"Any break is better than an infinite loop".
A self-perceived apt quote from the computers of 221B. Much of the 9th and 10th week of this case of GSoC was spent on finding the crook line of code.
It has been an axiom of mine that little things like a "break" are infinitely the most important.
After I was done playing detective-detective with my bugs I was able to carry out the following tasks:
DataTables:
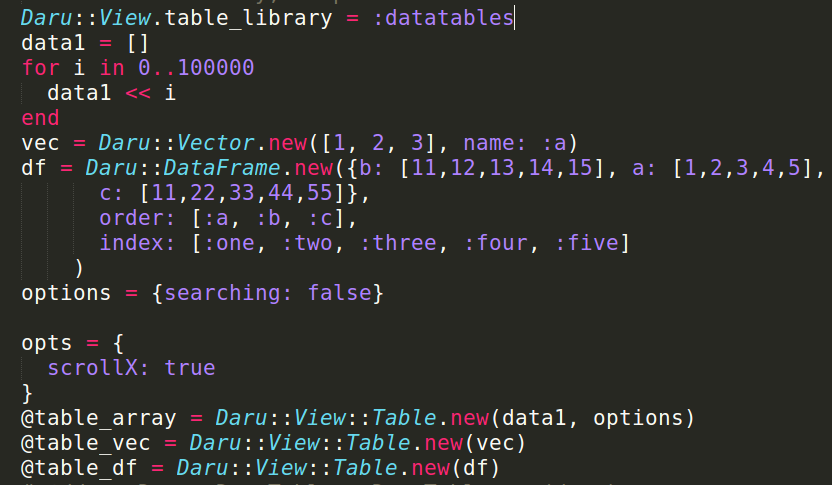
For the past few days, I have been working on the DataTables (PR #104 in daru-view and PR #20 in daru-data_tables) and have achieved the following tasks in it:
Use javascript Array rather than HTML table in DataTables:
There is nothing more deceptive than an obvious fact.
Earlier, data was converted in the form of HTML table. Things got better when I shifted to javascript array for the further server-side implementation (as datatable can take Array of Array).
Resolved this issue in DataTables.
There was an issue the datatables that all the tables were overwritten by the last drawn table. This has been resolved now.
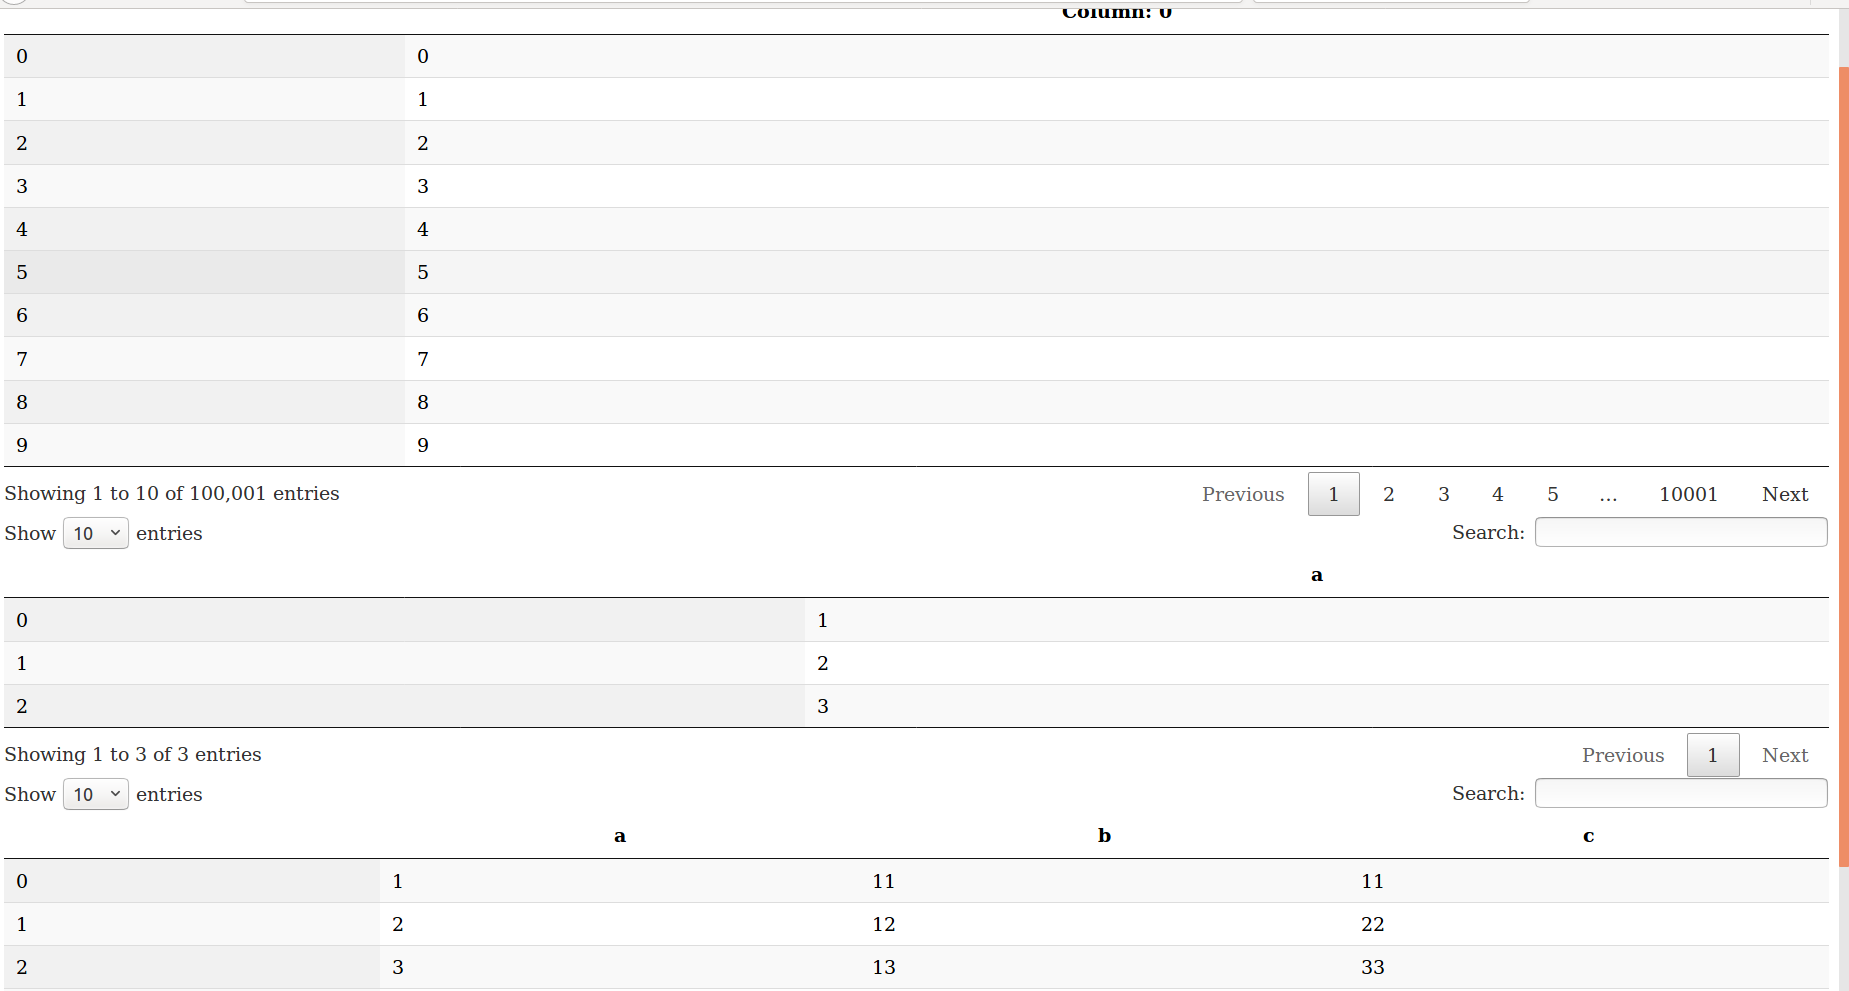
Loading a large set of data piece by piece:
I have implemented server-side processing (using ajax option in DataTables) in DataTables for more than 50000 data rows and client-side processing below that. This is done because server-side processing searching is not done properly.
This feature enables the user to load millions of rows in the table.
Updated the API of daru-data_tables:
Lots of updating and refactoring was done to improve the API of daru-data_tables.
Added export_html and generate_html methods for datatables:
Added these methods to export the HTML code of the table in a file.
Added tests and documentation:
A fact is correct not to be accepted.
Testing and documentation were the need of the hour in daru-data_tables. Along with tests in daru-data_tables, I added specs and documentation for the datatables adapter in daru-view.
Added rails examples in daru-data_tables:
To demonstrate the features of this gem, I added some rails examples in the same.
Formatters in GoogleCharts:
The Google Visualization API provides formatters that can be used to reformat data in a visualization. These formatters change the formatted value of the specified column in all rows. There are six kinds of formatters available right now: Arrow, Bar, Number, Date, Color, and Pattern. To catch up with the progress of this feature, follow this PR and check out these examples.

Difficulties:
Out of these six formatters, Arrow and Bar are causing some issues and rest are working fine.
Bar formatter is working correctly in rails but in IRuby notebook it generates weird bars. Arrow formatter is neither generating arrows in nbviewer (working fine in localhost) nor in rails.
Added a method to load dependent scripts for multiple adapters:
I have added this method to load the dependent script for multiple adapters at once in both IRuby notebook and web frameworks in this PR. Have a look at these examples.

One thought on “GSoC 2018 | Coding Week – 9, 10”